PROTOTYPE 1
"Once they understood the mapping, the interaction started to feel more like playing an instrument than operating a device."
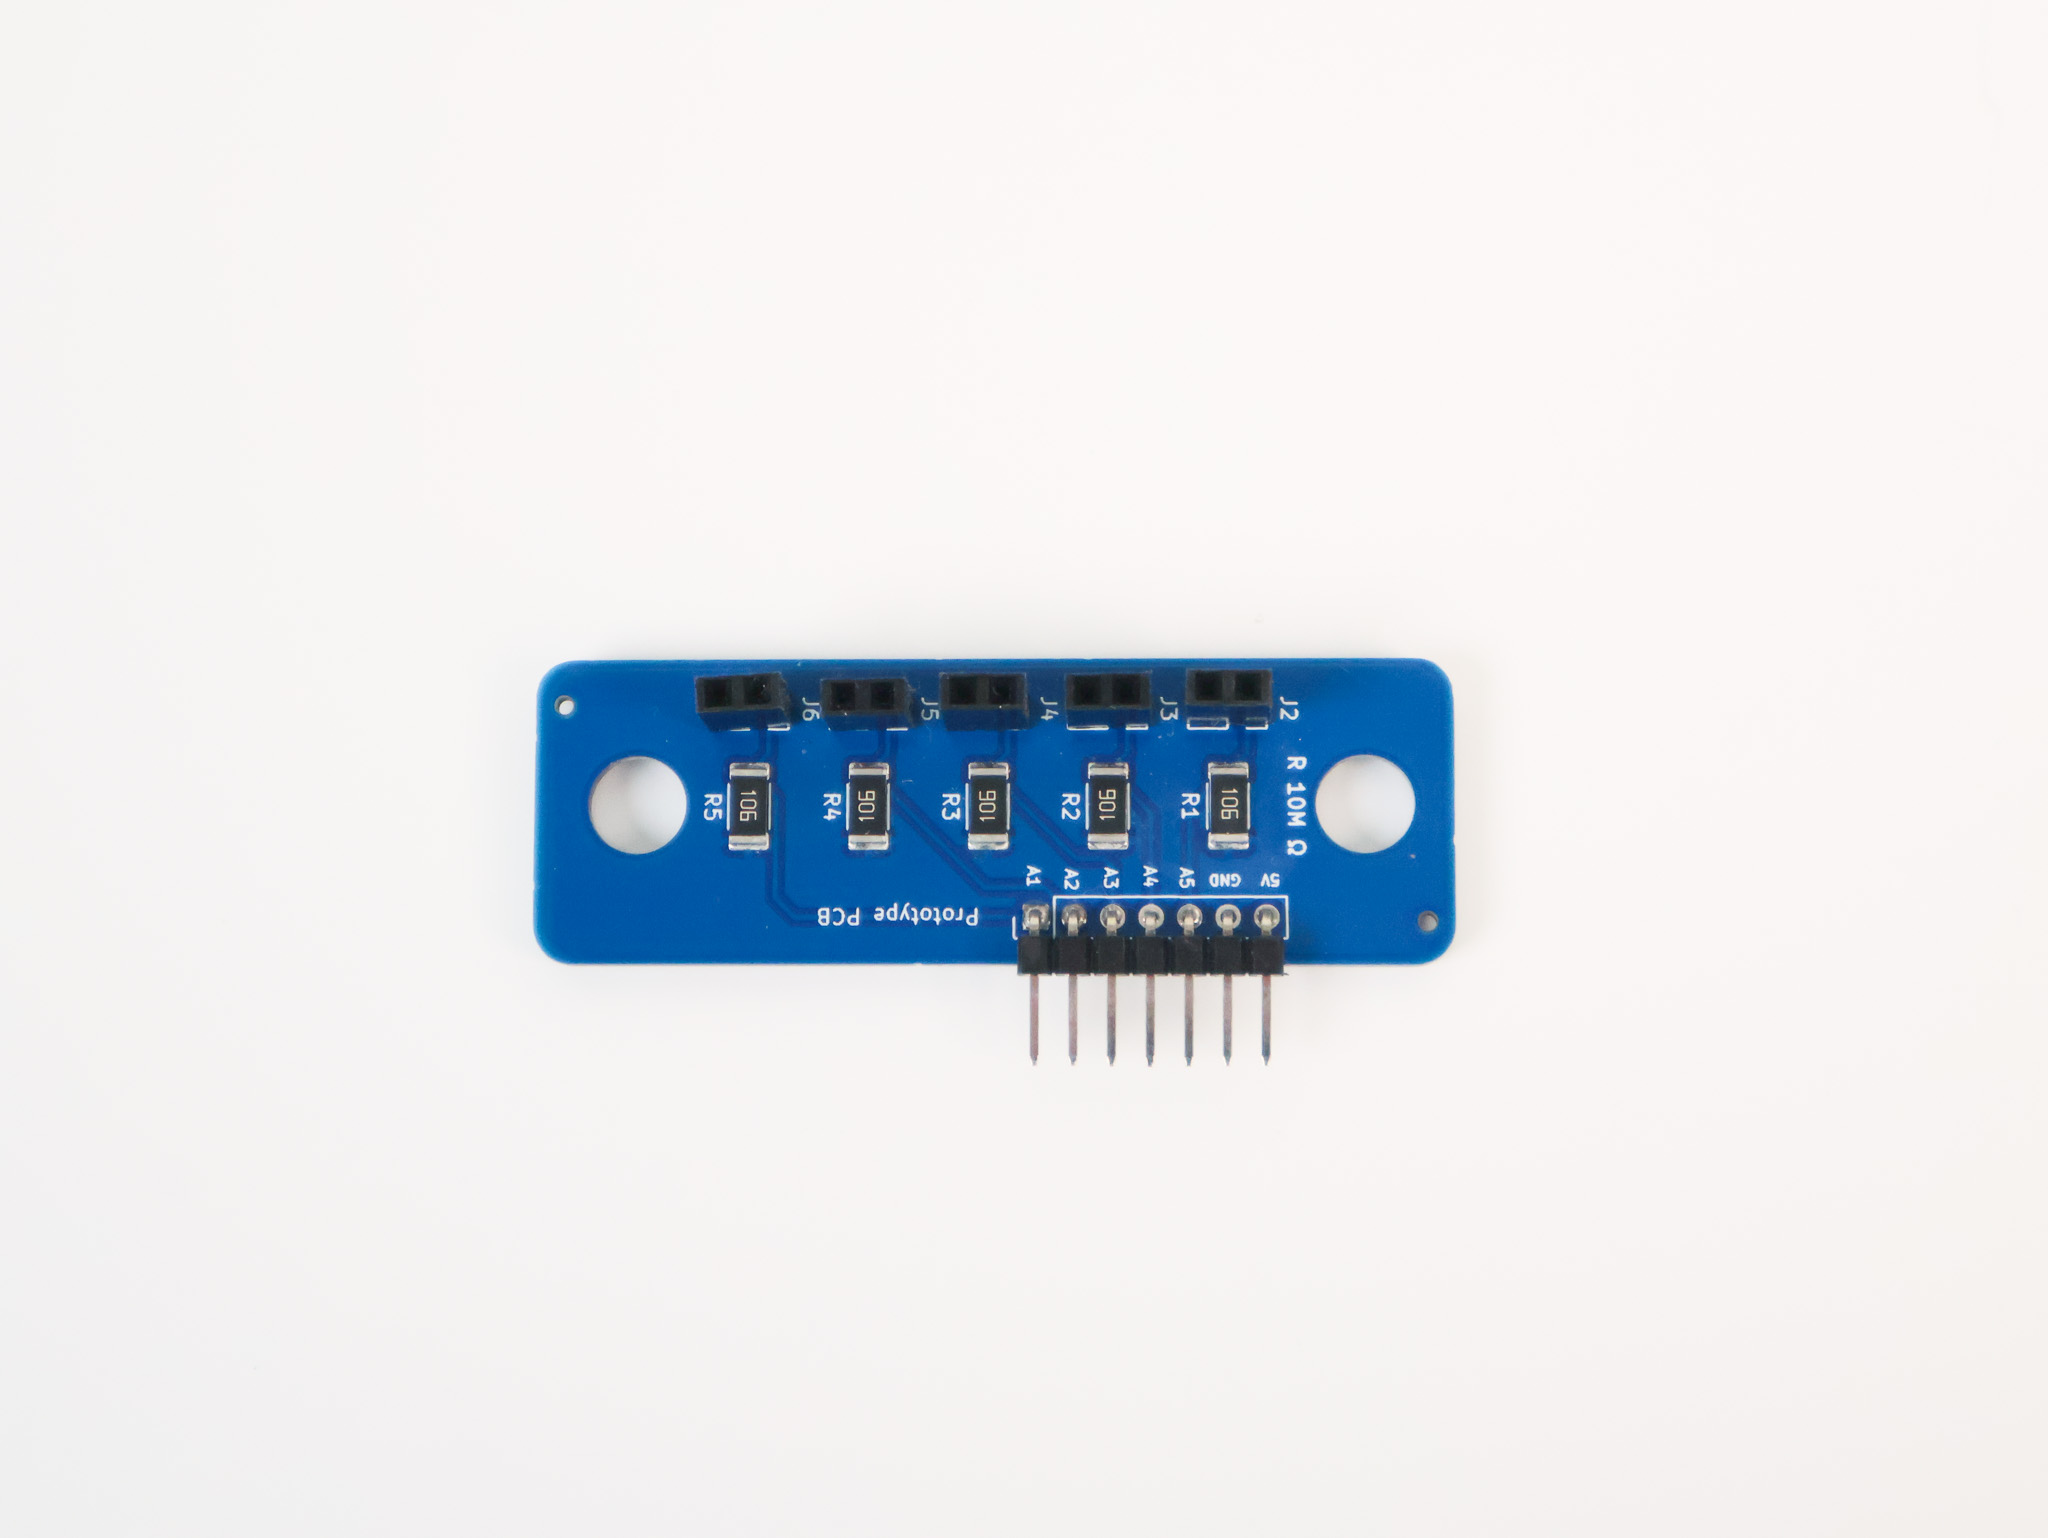
Texture as the primary differentiator. Each of the five bars was 3D modelled in Blender and printed with a distinct surface, allowing performers to navigate the interface by feel rather than sight. The linear xylophone form came from sensor testing where a row arrangement had already felt intuitive; it was formalised into a design language.
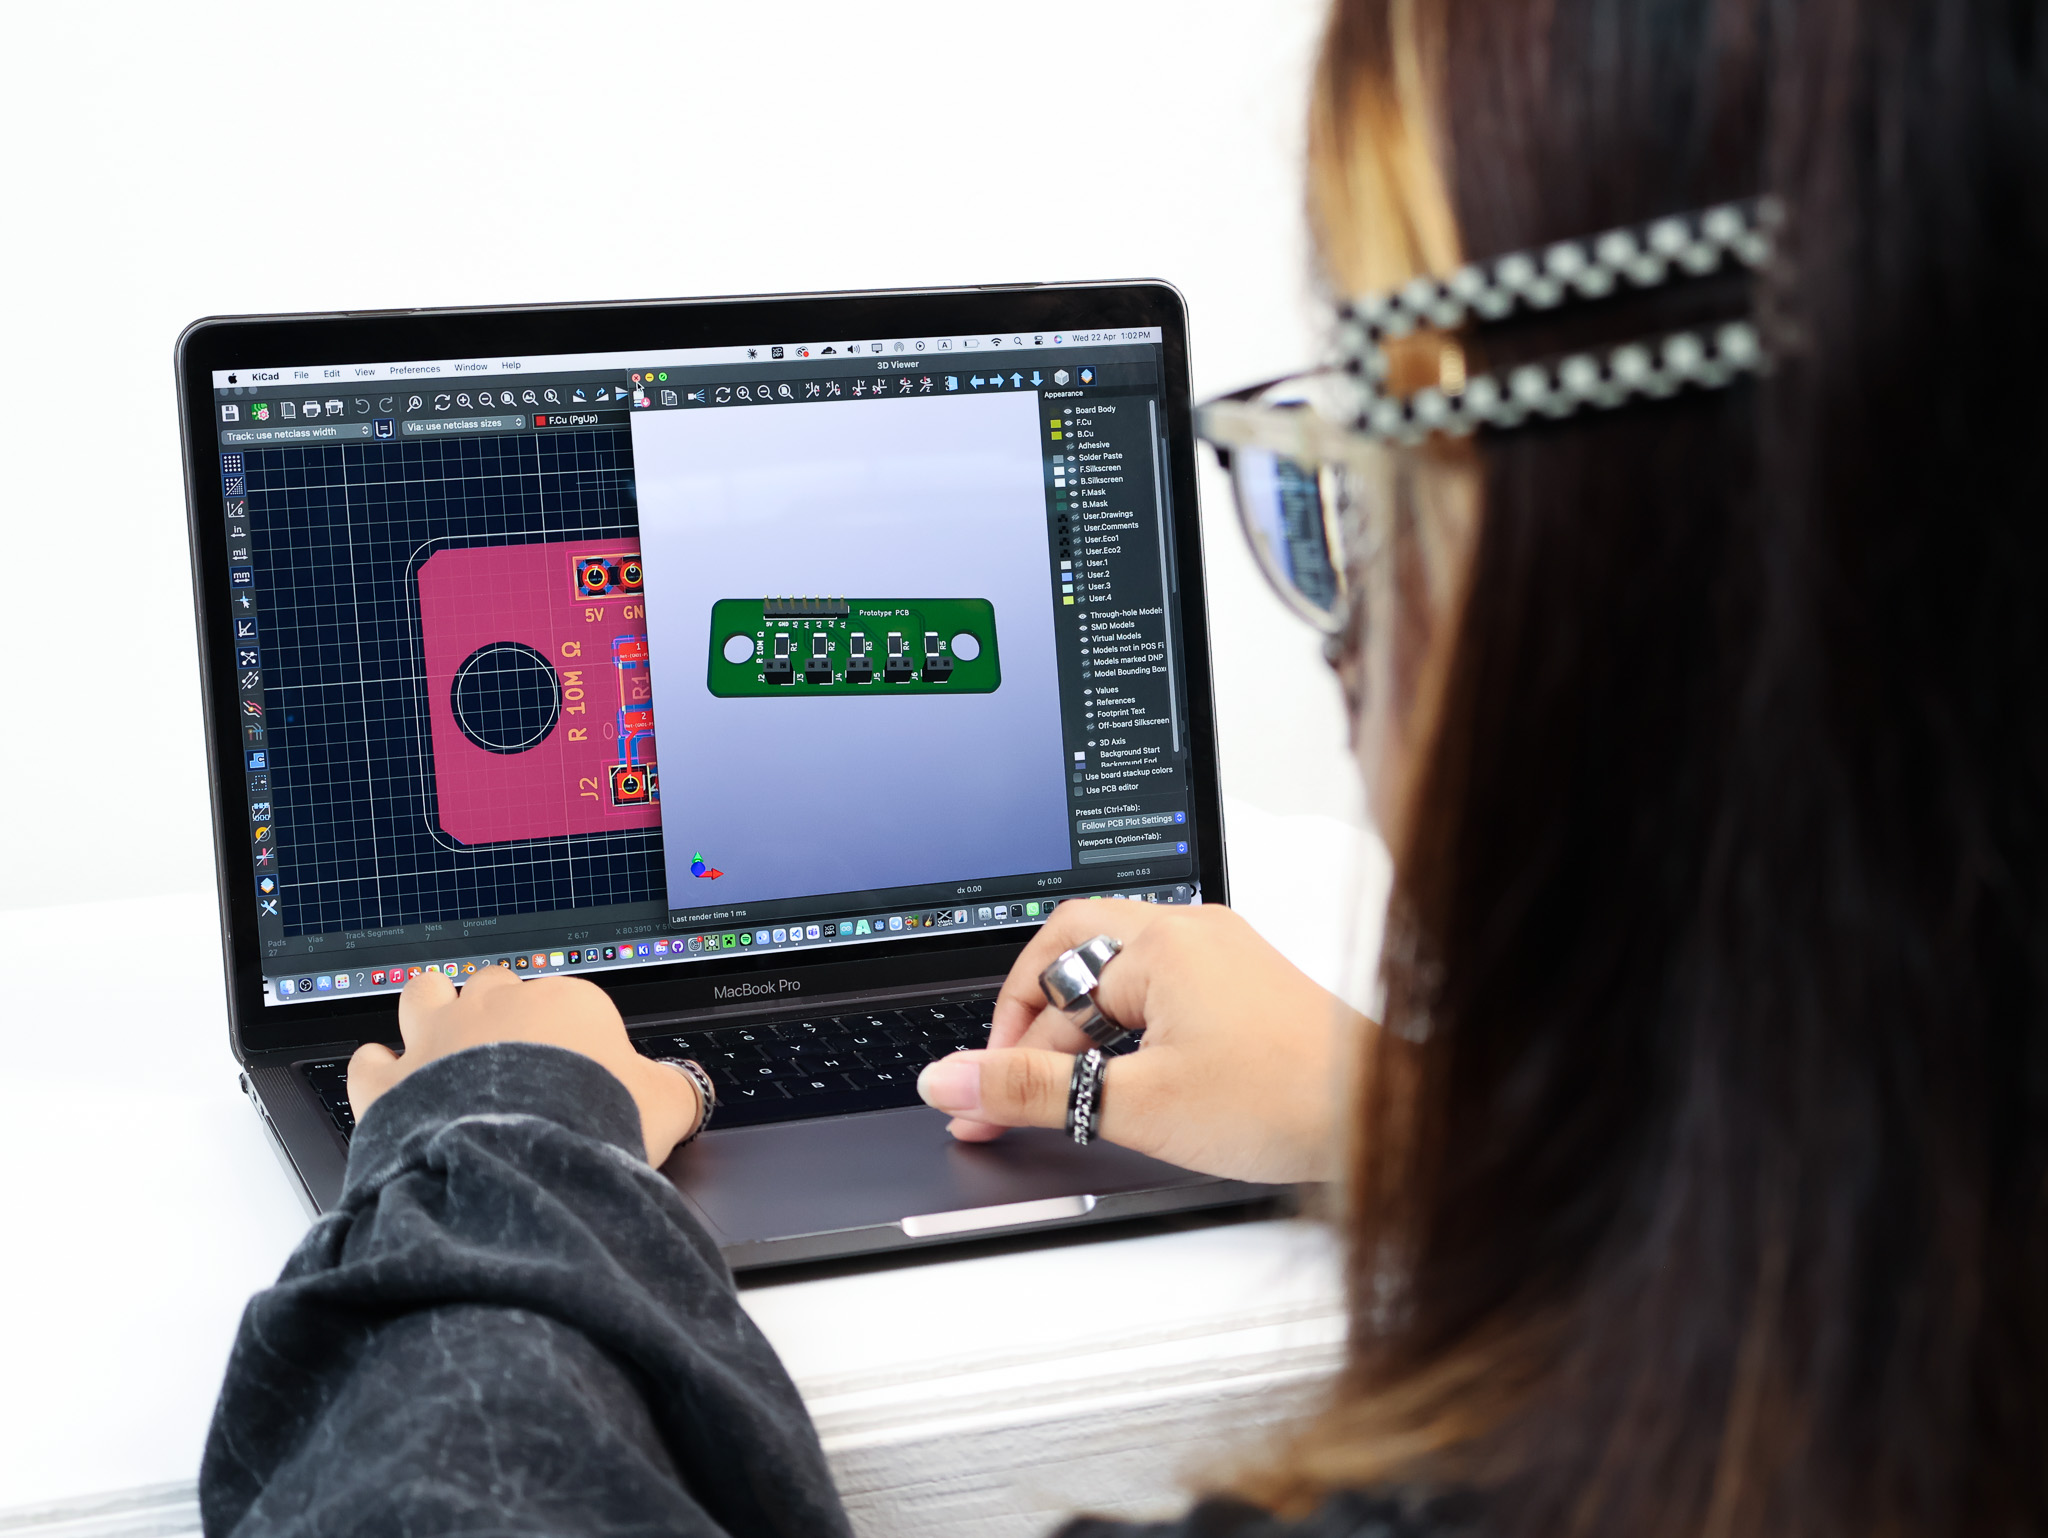
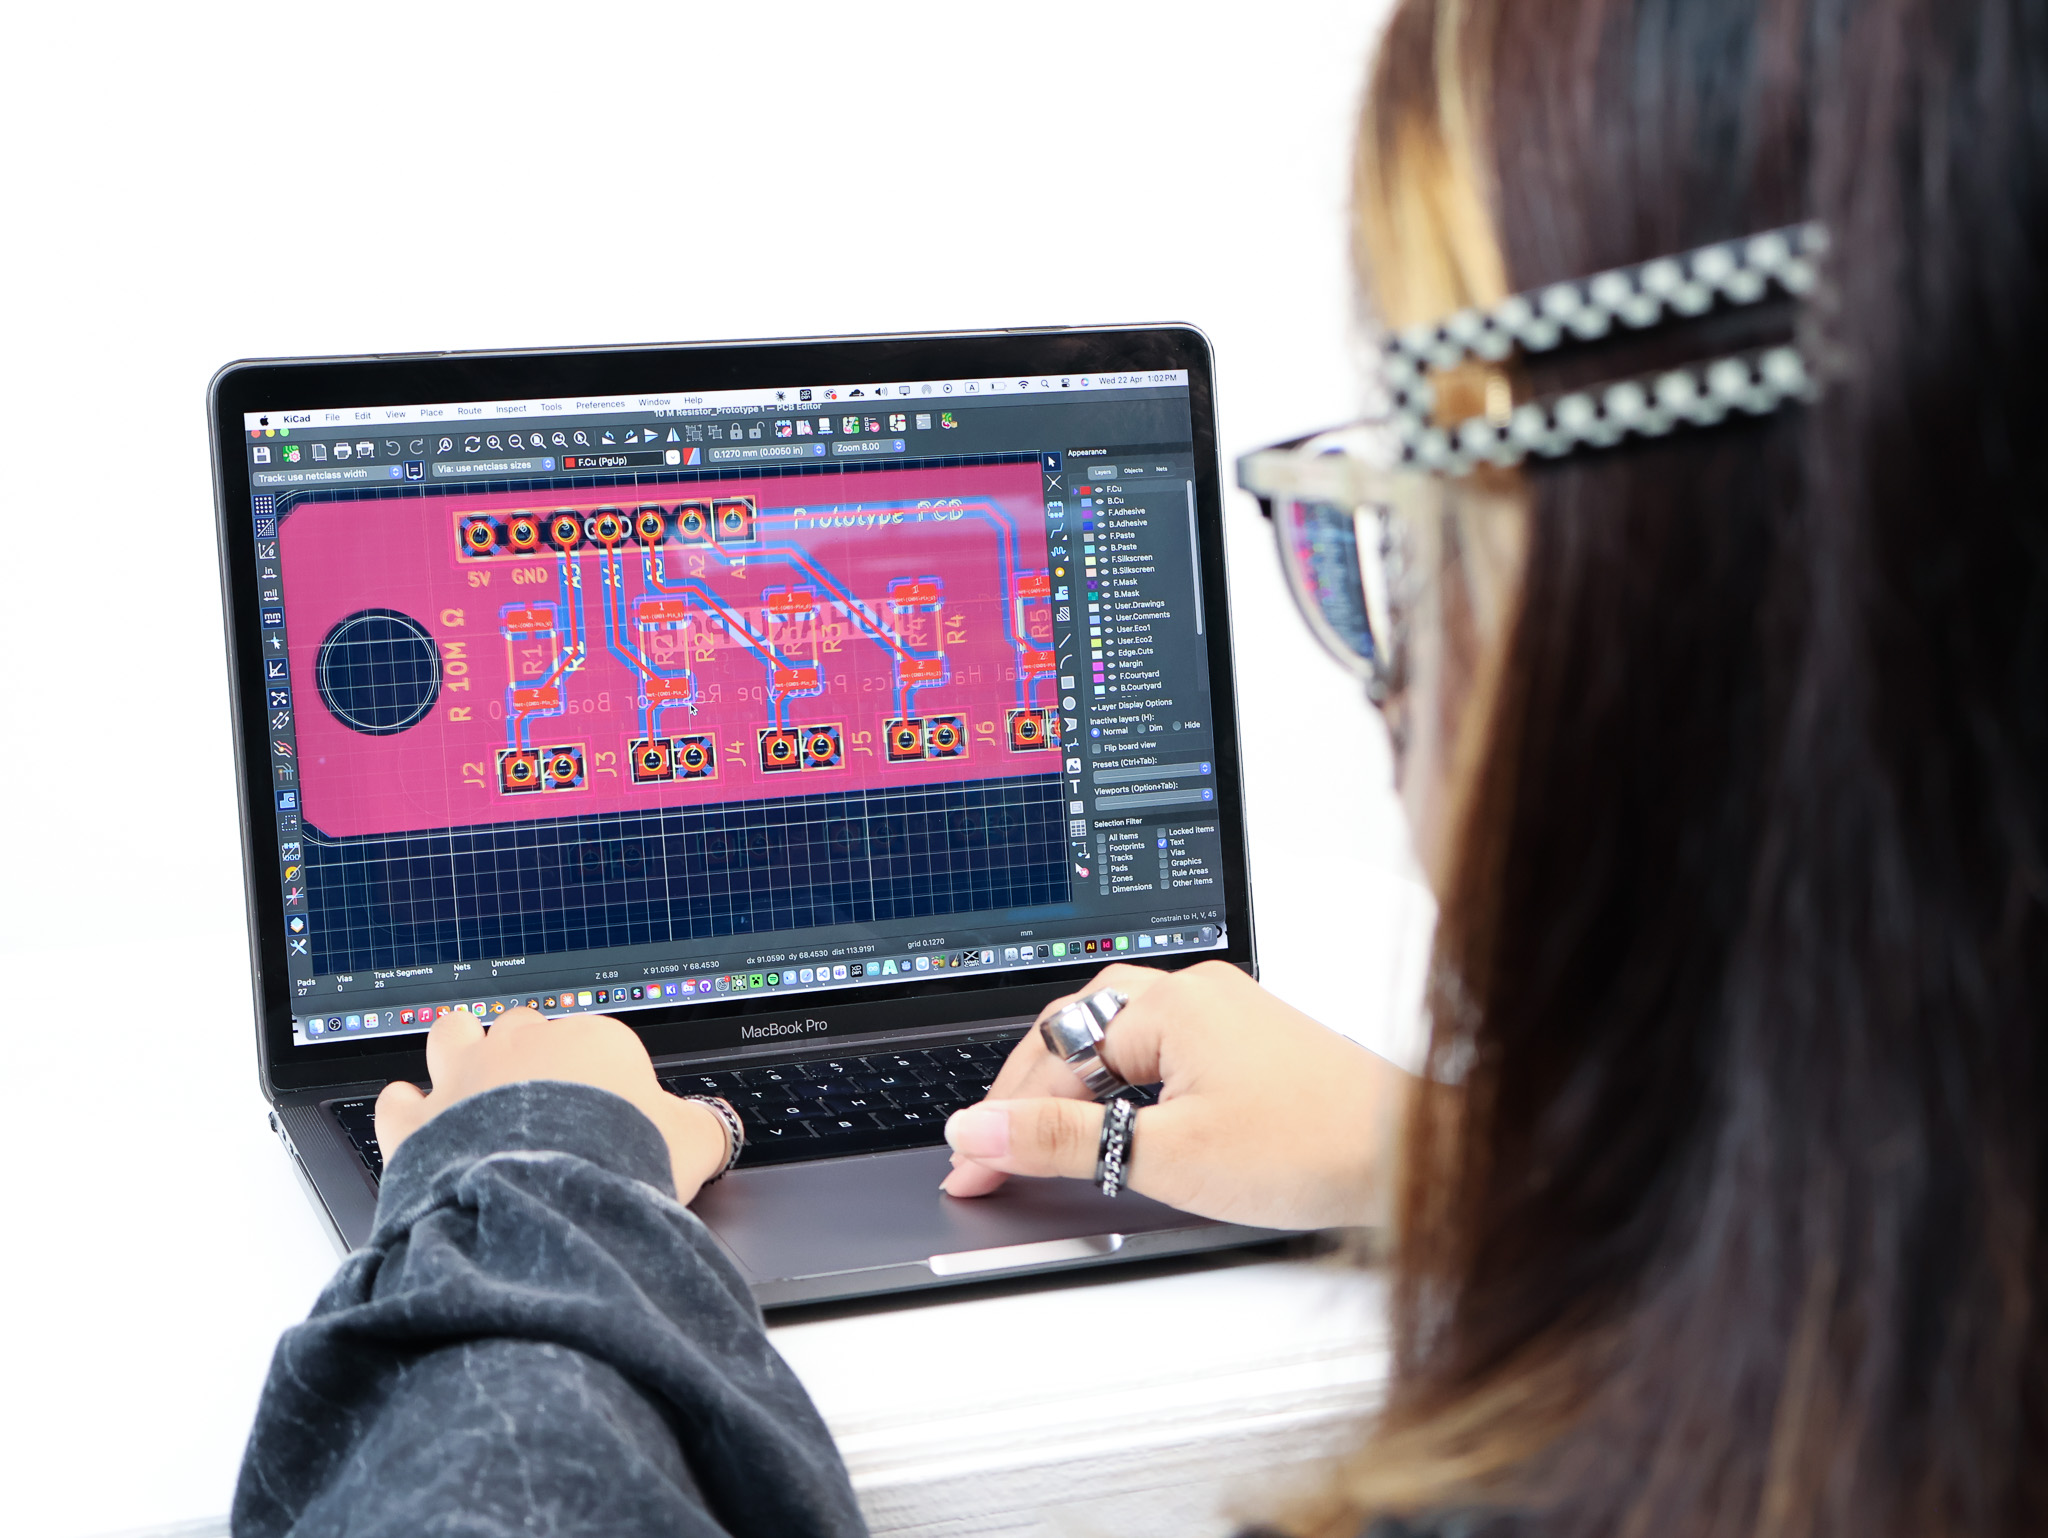
Built under Research through Design, the prototype itself is the inquiry. The goal wasn't a finished product, it was to find out what the making revealed about the design problem: what the sensors could actually do, how the form affected interaction, and what visual feedback needed to feel responsive rather than random.
Piezo sensors sit beneath each bar, picking up both pressure and vibration transmitted through the surface, not just direct contact. This is what makes the interaction expressive: a tap, a firm press, a light brush all produce different signal peaks, giving the performer dynamic range across each zone.
The Arduino UNO connects to the sensors via analog input pins, with 10MΩ resistors to ground to stabilise the signal. Sensor data feeds into a p5.js sketch: each zone controls a horizontal band, one zone highlights on activation. A deliberate simplification to prove the connection before adding complexity.
p5.js - Pressure to Visual
Prototype in Use
| Participant | Q1 | Q2 | Q3 | Q4 | Q5 | Q6 | Q7 | Q8 | Q9 | Q10 | SUS Score |
|---|